Over the last decades, free-electron-based cathodoluminescence (CL) spectroscopy has advanced to provide the best combination of space, momentum, energy, and time resolutions for nanoscopic optical characterization. Considerable attention has been attracted in various research fields, such as nanophotonics, materials science, and fundamental physics, for the outstanding ability of free electron beam to access to optical states beyond the diffraction limit of light. Innovative developments in collecting and analyzing the emitted light from electron-light-matter interactions show promise for meeting the rapidly increasing demand in quantum optics. In general, 2D CL maps can be acquired by raster-scanning an energetic electron beam over the spacemen using a scanning electron microscopy (or a scanning transmission electron microscopy) mounted with an optical spectrometer, then constructed for each emitted light wavelength as hyperspectral imaging. The time-varying electromagnetic field accompanying a moving electron covers a wide spectral range (0-30 eV), and thus can excite various optical modes like a broadband optical pulse, yet with an inimitable spatial resolution in few-nm range. As a result, the in-depth and multidimensional analysis of space-correlated CL emissions associated with localized and propagating surface plasmons, optical modes in dielectric cavities and photonic crystals, excitons, etc., can provide unprecedent insights into light-matter interactions, which play an instrumental role in spectroscopy, sensing, quantum information processing and lasers.
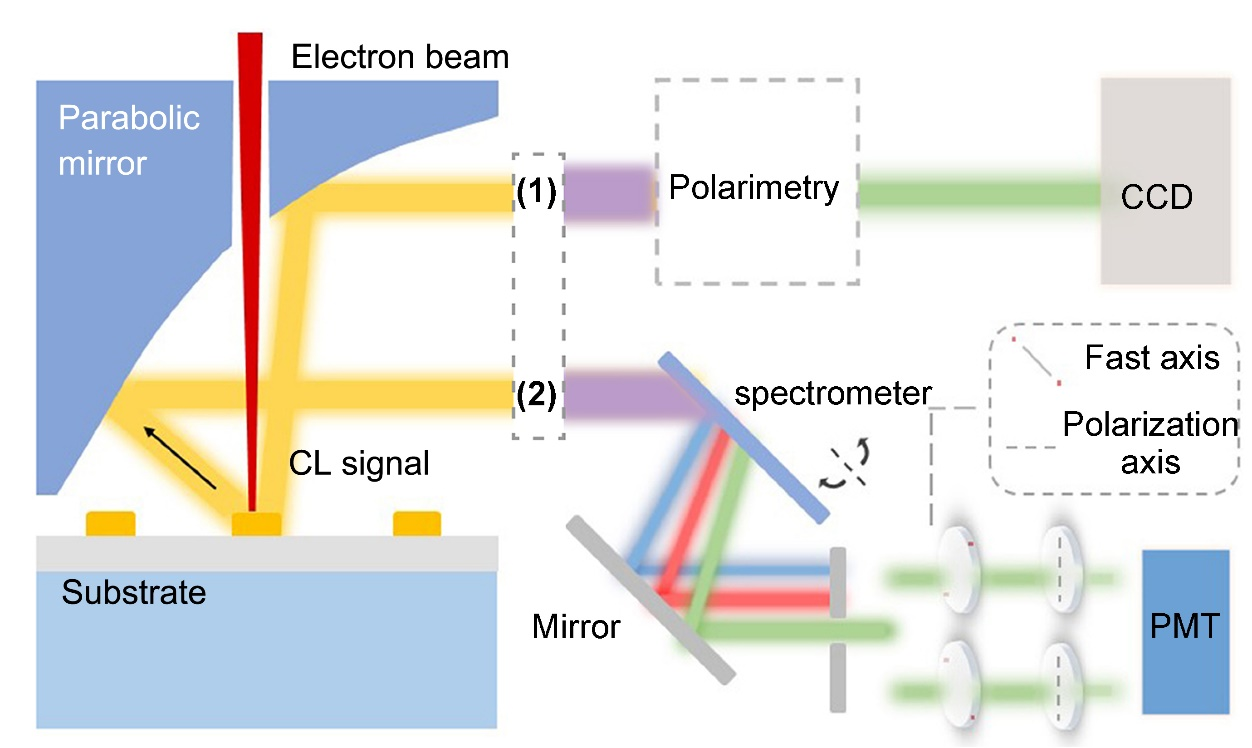
Our group has developed a unique CL spectroscopy instrument that enables the study of nanostructures with deep-subwavelength optical resolution. In a scanning electron microscope mounted with a CL detector, a 5-30 keV electron beam is used to excite nanophotonic structures, while the emitted light is collected by a parabolic mirror placed between the sample and the microscope column.

The Optical path of our SEM-CL detection platform
Spectral analysis: measuring the local density
The collected CL radiation can be spectrally analyzed for every electron beam position, so that a two-dimensional emission map can be recorded. This map is related to the local density of states (LDOS) that directly determines the radiative properties of quantum emitters. The spatial resolution can be down to 3 nm in the 400-900 spectral range.
Polarimetry: revealing and manipulating the chirality
Using a linear polarizer and a quarter-wave plate, 4 independent polarization-resolved measurements can be done from which the full set of Stokes parameters is derived. This enables identification of the degree of linearly and circularly polarized light emitted from the sample. In addition, with a proper design of nanostructures, the chiral state of CL emission can be manipulated actively by moving electron beam position.
Angular measurements: momentum spectroscopy
An imaging CCD camera records the beam profile emanating from the mirror. From this profile, the angle-resolved radiation pattern from the sample can be derived, enabling “momentum spectroscopy”, measuring the in-plane wave vector of light at every frequency and position. Using this technique, the local bandstructure of periodic structures and optical spin hall effect of a single nanosructure can be determined with a spatial resolution of 10 nm.
Time resolved measurements: beam blanker
We have added time-resolved detection capabilities to the microscope. Using an electrostatic beam blanker, electron pulses shorter than 100 ps can be made, and the statistics of the emitted cathodoluminescence is recorded using single-photon counting and correlation spectroscopy. This enables nanometer-resolution lifetime imaging, studies of (anti-)bunching of single quantum emitters, and much more.
Representative works:
[1] Acs Nano 12, 3908-3916 (2018).
[2] Nano Letters 18, 567-572 (2018).
[3] Nano Letters 19, 775-780 (2019).
[4] J. Phy. Chem. C 124, 13886-13893 (2020).
[5] Sci Adv 7, eabf8011 (2021).
[6] Nat. Commun. 12(2021).